Available for Remote Work & Freelance Projects
Jeremiah Emrich
Data Analyst — Python / SQL
I turn raw data into decisions — building SQL-backed analysis, interactive Power BI and Streamlit dashboards, and applied AI tooling with Python and Pandas. Shipped a Python → SQL → Power BI pipeline analyzing state tax policy, a 39,000+ record aviation safety dashboard, and production RAG/LangGraph AI agents. Backend engineering background (12 deployed apps) adds full-stack depth most analysts don't have.
12
Live Production AppsPython → SQL → BI
Pandas · SQLite · Power BIAI / Agents
RAG · LangGraph · Vector SearchFeatured Work
A sample of what I've shipped — see all 12 live projects on the Projects page.
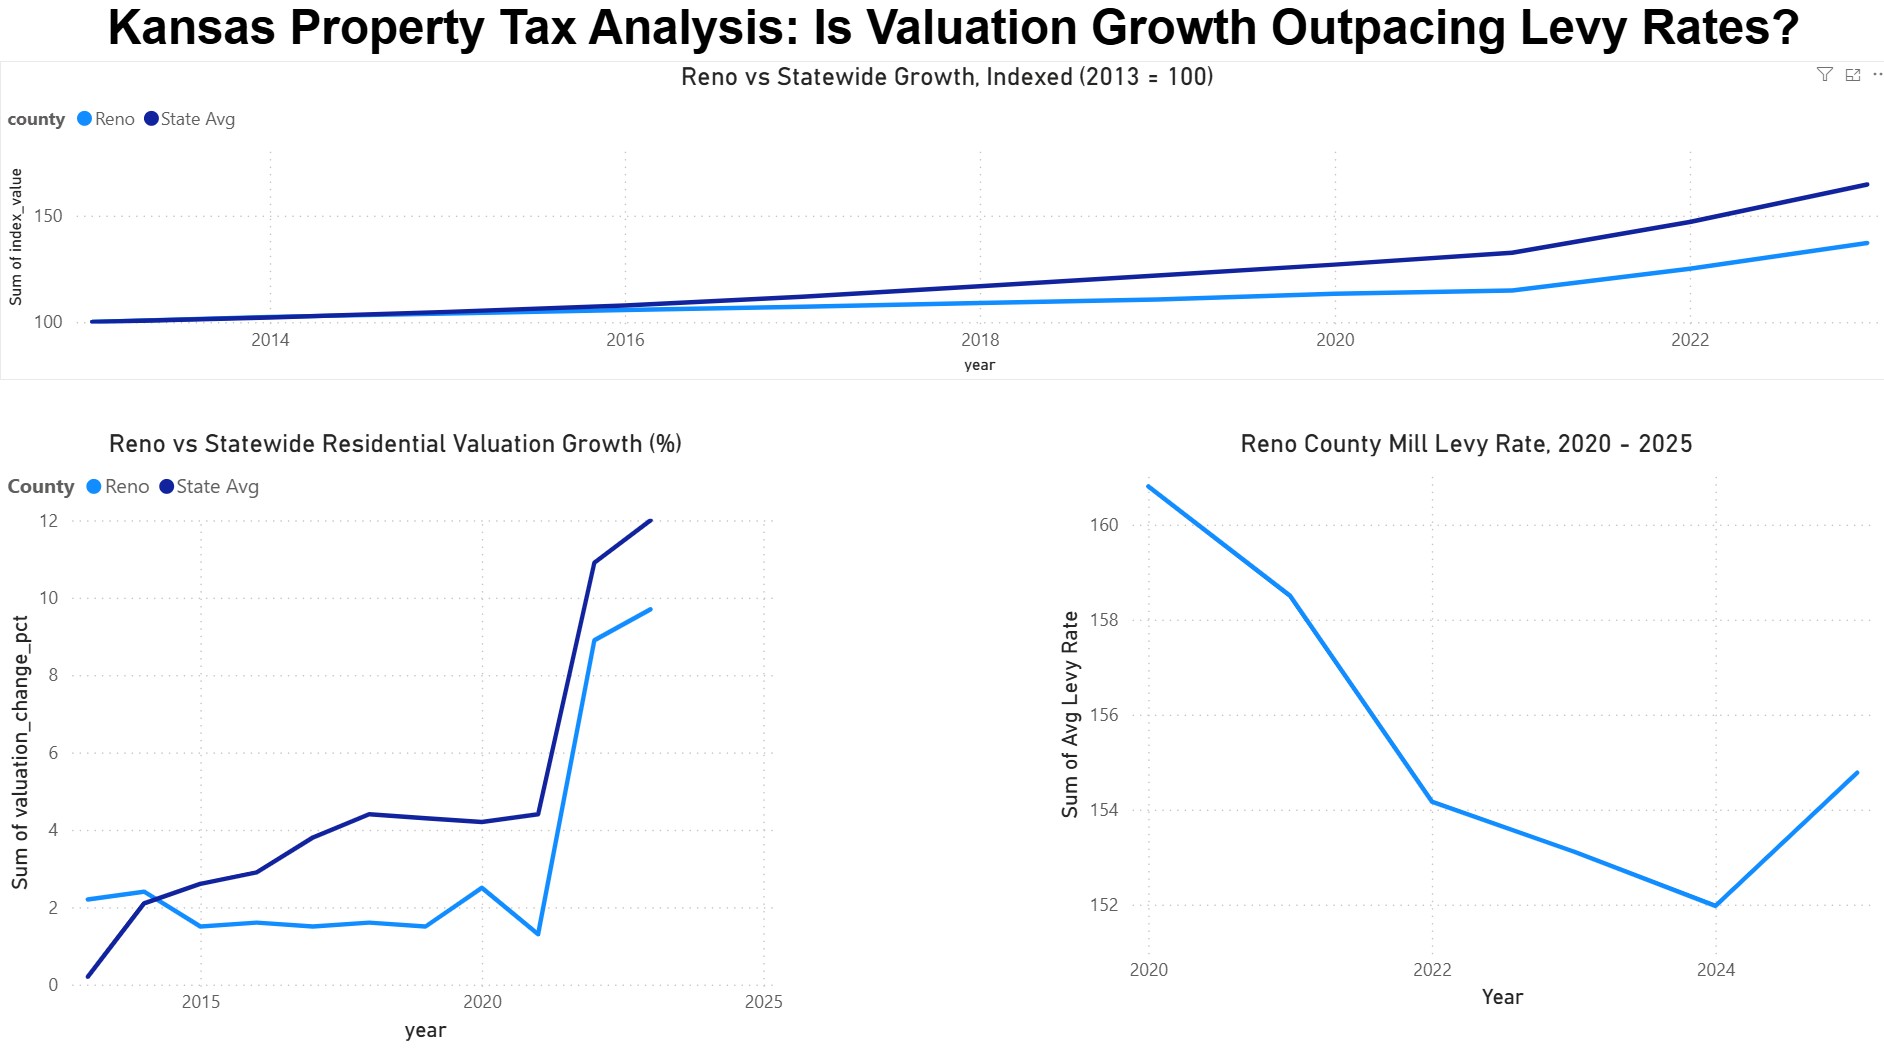
Kansas Property Tax Analysis
FlagshipAn end-to-end Python → SQL → Power BI pipeline answering a real civic question: is Kansas property tax growth driven by rising valuations or rising mill levy rates — and would relocating to a neighboring state actually lower the bill? Extracted and validated data from unstructured government PDFs (KDOR, Lincoln Institute) with pdfplumber, loaded it into a SQLite database with SQL views, then built an interactive Power BI dashboard with a county-level deep dive and a 5-state comparison.
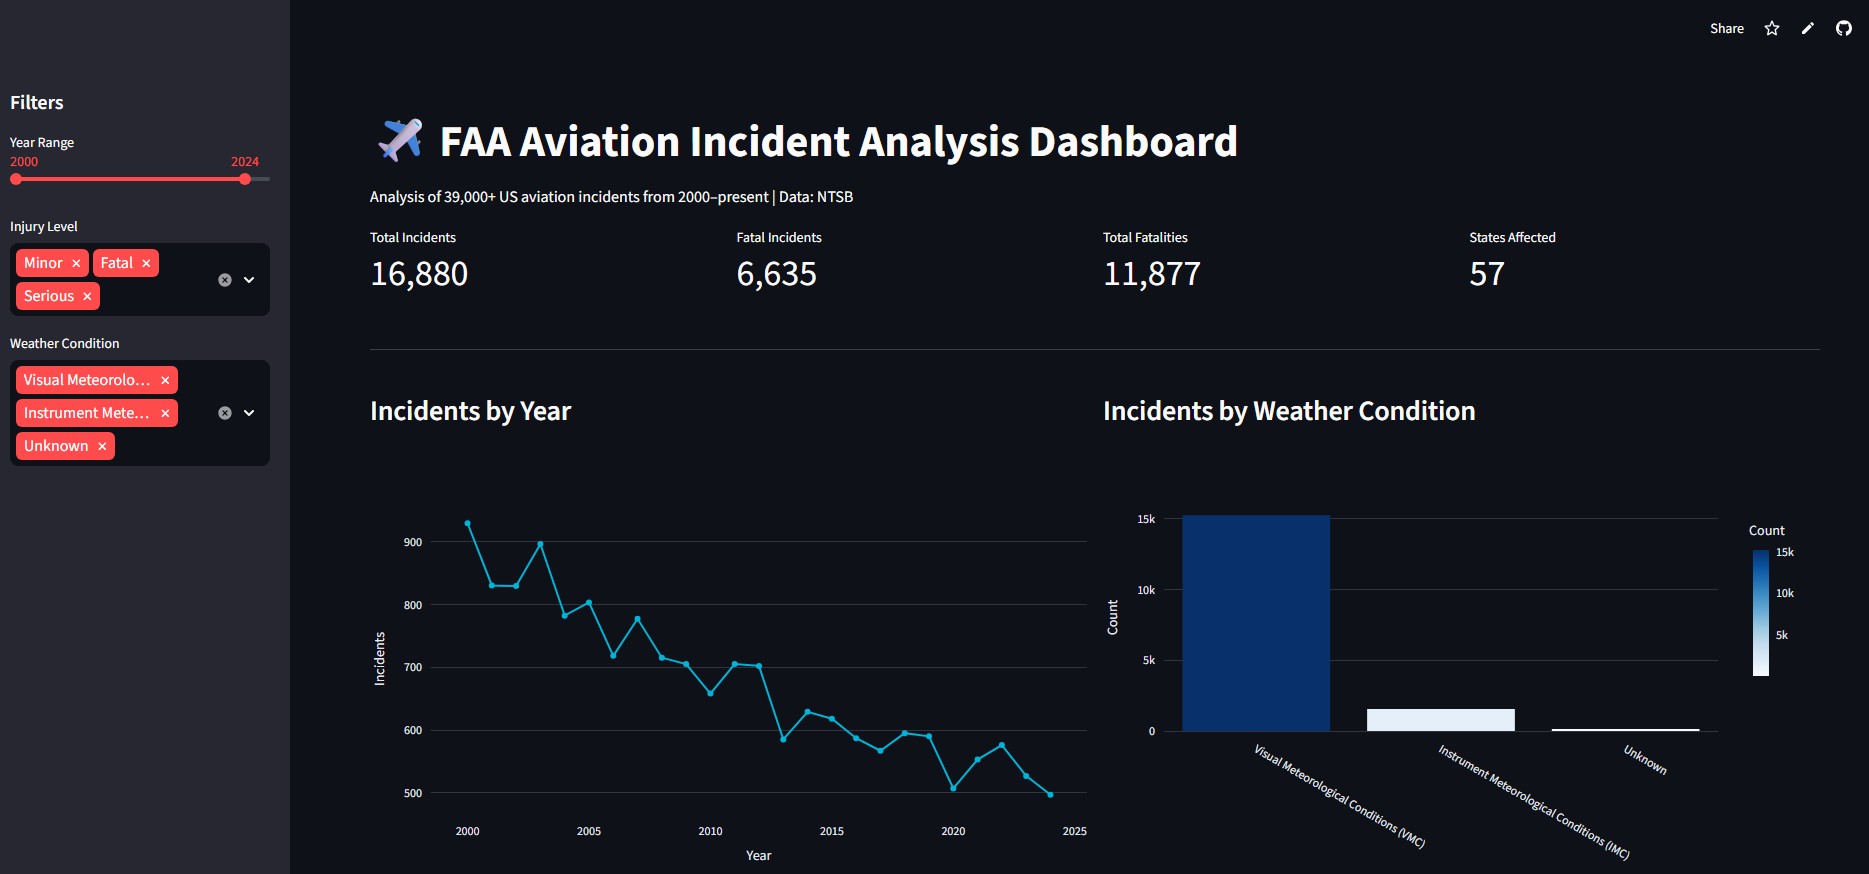
FAA Aviation Incident Analysis Dashboard
Flagship25 years of NTSB aviation incident data (39,000+ records) explored through an interactive Streamlit dashboard — trend lines, injury-level breakdowns, weather-condition analysis, and a US choropleth heatmap of incident density. Built with the domain expertise of an FAA-certified Airframe Mechanic: every insight is grounded in real aerospace maintenance and regulatory experience, not just the raw numbers.
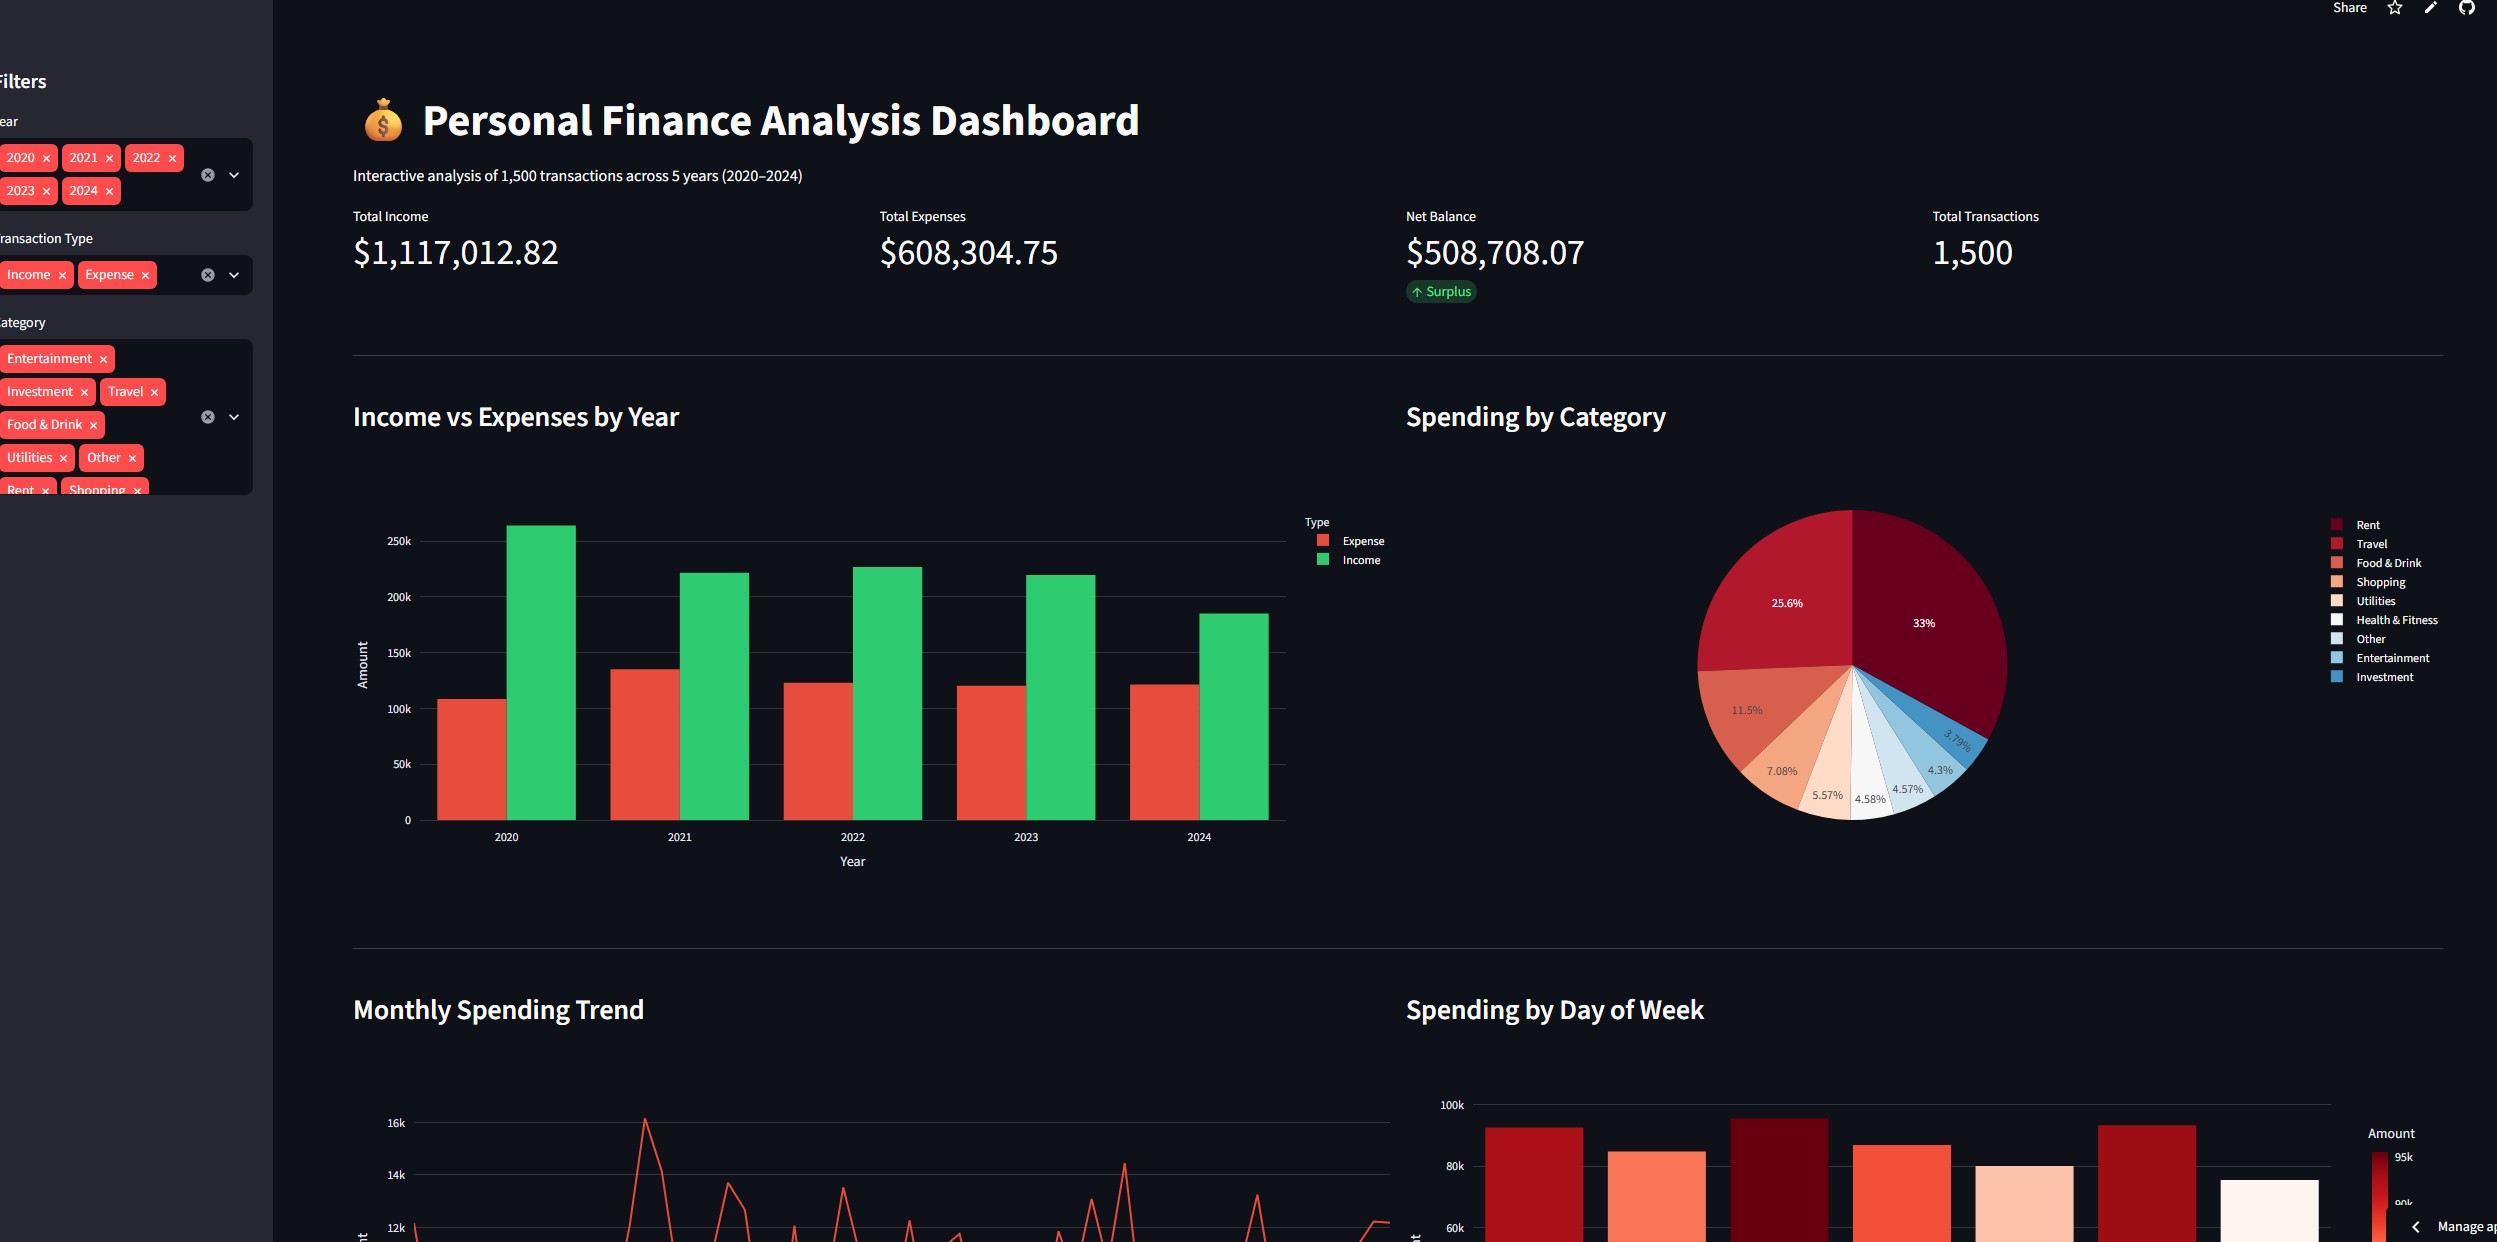
Personal Finance Analysis Dashboard
FlagshipAn end-to-end data analytics pipeline exploring 1,500 personal finance transactions across 5 years (2020–2024): synthetic data generation, data cleaning, SQL-based analysis in SQLite, interactive Plotly visualizations, and a 6-month linear regression forecast. Full workflow documented across 4 Jupyter notebooks covering cleaning, SQL queries, visualization, and forecasting, with dynamic KPI filtering and income/expense breakdowns by category and day of week.

Erin the Estie
FlagshipA full-stack booking platform built for a real paying client — an esthetician who needed scheduling without a subscription fee. Custom appointment system with an approval workflow, service menu management, and a mobile-optimized admin dashboard. Requirements through deployment, owned end to end.